Price Chart Help
You can draw Price Charts showing time or date and price for your equities, indexes, or mutual funds. You can track the progress by ticks, a specified number of minutes, daily, or weekly.
DTN.IQ Chart maintains a menu of your symbols. You can search for symbols and company names and add the symbols to the menu.
The following data can appear on a Price Chart:
- Tick data, which are presented in real-time and are dynamic.
Tick data display each individual trade. As new trades occur, the system redraws the Chart. You can delete selected ticks and restore all deleted ticks.
- Minute data, which are presented in real-time and are dynamic.
Minute data are accumulated tick information based on the interval you select. The system redraws the Chart at each selected interval, such as every 10 minutes. You can delete selected minute bars and restore all deleted minute bars.
- Daily and weekly data, which are historical data for the past 2 years and are not updated dynamically.
- Candlestick Chart, which is similar to a Bar Chart except that instead of the high-to-low vertical lines and horizontal ticks that identify the day’s open and close, it uses two-dimensional bodies to identify the open-to-close trading range and uses upper and lower stems to mark the day’s high and low.
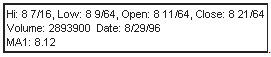
- Detailed data for each data point, such as this tick mark data:
 .
.
| Chart Type | Detailed Information |
| Tick | Price, volume, time, moving average 1, moving average 2, moving average 3 |
| Minute | High, low, open, close, volume, time & date, moving average 1, moving average 2, moving average 3 |
| Daily | High, low, open, close, volume, date, moving average 1, moving average 2, moving average 3 |
| Weekly | High, low, open, close, volume, week of, moving average 1, moving average 2, moving average 3 |
- Trendlines, which are upward or downward lines showing movements of average prices over a period of time.
- Moving averages, which are plotted over the other data to show a general trend of the plotted data points.
- Bollinger Bands, which vary in distance from the average as a function of a stock’s volatility. You can use Bollinger Bands to judge the trending tendency of markets, using the distance between the upper and lower bands.
You can also display the following Charts:
- Volume Charts, which show volume of the selected equity, index, or mutual fund traded by ticks, minutes, daily, or weekly.
- Indicator Charts, which are used to predict the market’s conditions, such as volume of stock trading, direction of interest rates, and buying or selling of corporate insiders, and to display the overall health of the economy.
You can modify Price Charts by deleting and restoring tick marks or minute bars. You can also change your selections such as the symbol or increment and redraw the Chart.
You can display Charts for different settings by opening multiple DTN,IQ Chart windows and drawing a different Chart in each window.
Tip: You can use the Chart Settings dialog box to select default components and colors of Charts, and then use the Chart toolbar to select the symbol, symbol type, and increment.
To draw a Price Chart:
- From the DTN.IQ Smart Bar, click on the Chart icon.

- Click on the toolbar Settings icon.

The Settings dialog box appears.
- Select the General tab.
- From the Chart Type drop-down menu , select H/L/O/C (for High/Low/Open/Close).
- Click on OK to close the Settings dialog box.
- From the toolbar Symbol drop-down menu
 , select a symbol.
 - From the toolbar Chart Increment drop-down menu
 , select tick, minute, daily, weekly, or monthly.
 - If you select minute, from the toolbar Minute drop-down menu select the minute increment.
- Click on the toolbar Draw Chart icon.

The system draws the Chart.
You can also display a Volume Chart and an Indicator Chart.
Tip: If you click on a data point tick mark, detailed information such as the following appears:
.
To search for a company symbol:
- From the DTN.IQ Smart Bar, click on the Chart icon.
Note: You can search for a symbol from a blank window or from a window with a Chart.
- Click on the toolbar Symbol Search icon.

The Search for Company dialog box appears.
- Type the name of the company whose symbol you want.
- Click on Search.
The system displays a list of companies and symbols that match the name you entered.
- Double-click on the company/symbol.
The Search for Company dialog box closes and the symbol appears in the symbol box on the toolbar.
- You can select the type of data (tick, minute, daily, or weekly) and draw a Chart for the symbol.
Tip: After you draw a Chart for a symbol, the symbol remains on the symbol drop-down menu for future selection.
To select Price Chart colors:
- From the DTN.IQ Smart Bar, click on the Chart icon.
- Click on the toolbar Settings icon.
The Settings dialog box appears.
- Select the Color tab.
- Click on a Price Colors color box:
- Label to change the color of the vertical and horizontal axes and labels on the Price Chart.
- Data to change the color of data point tick marks.
The Color dialog box appears.
- Click on a color.
- Click on OK to close the Color dialog box.
- Repeat steps 4 to 6 to change the other colors.
- Click on OK to save your selections and close the Settings dialog box.