Time and Sales Overview Help
The DTN.IQ Time & Sales application displays raw data in a waterfall format for an equity, indicator or index symbol by tick or a for specified time period.
You can display the Time & Sales data by ticks, by a specified number of minutes, by day, or by week.
- Tick data displays all or a specified number of trades.
- Minute data is accumulated tick information based on the interval you select. Minute data are displayed for all or a specified number of days.
- Daily data is historical data for the past two years.
- Weekly data is historical data for the past two years.
You can open multiple DTN.IQ Time & Sales windows.
Note: Time & Sales tables display the raw data used by DTN.IQ Chart in tabular format.
The DTN.IQ Time & Sales window consists of the following:
- Trend symbol:
- Flat Trend

- Up Trend

- Down Trend

- Flat Trend
- Time & Sales Toolbar has buttons and drop-down menus from which to make your selections.
- Table column headings for tick, minute, daily, and weekly data.
- Table with raw data for the selected equity symbol, displayed by tick or specified time period.
- Status bar showing the task the system is performing such as loading data; the price trend, such as up, down, or flat; the symbol such as IBM or DELL; the Time & Sales table type, such as tick, minute, daily, weekly, or monthly; and the number of data points retrieved.
You can use the buttons and menus on the toolbar to set up and create Time & Sales tables. Here are the functions you can perform with the Time & Sales toolbar buttons and menus.
| To perform this function: | Click on: |
| Select a symbol for the Time & Sales table | |
| Search for a symbol | |
| Get data for a Time & Sales table | |
| Select Time & Sales data columns and order | |
| Select Time & Sales load data options | |
| Select Time & Sales colors | |
| Select Time & Sales font | |
| Print Time & Sales data | |
| Save Time & Sales data to a file | |
| Filter Time & Sales data | |
| Select the data interval | |
| Select intervals for minute data | |
| Get a SnapQuote for the selected symbol | |
| Create a DTN.IQ Chart for the selected symbol | |
| Access news articles for the selected symbol |
Here are descriptions of all the data columns in the Time & Sales window. You can select which columns to display and arrange the columns in any order.
| Data Column | Description |
| Tick Data | |
| Time | Time of the current trade. |
| Date | Date of the current trade. |
| Price | Price at which a trade was made. |
| Tick Vol | Number of Shares/Contracts traded in the current trade. |
| Volume | Total Volume for the current day. |
| B Size | Number of shares offered at the best bid price |
| A Size | Number of shares offered at the best ask price |
| Info | Lists if it was a quote, trade or Form T trade. |
| Mkt Center | The exchange the current trade occurred on. |
| Bid | Best Price at which people are willing to buy a stock. |
| Ask | Best Price the seller is asking for the stock. |
| Minute Data | |
| Time | Time of the open for the minute interval. |
| Date | Date of the current interval. |
| Open | Opening price for the minute interval. |
| High | Highest price the stock reached for the minute interval. |
| Low | Lowest price the stock reached for the minute interval. |
| Close | Closing price for the minute interval. |
| Inc Vol | Number of shares/contracts traded in the current interval. |
| Volume | Total Volume for the current day. |
| Daily/Weekly/Monthly Data | |
| Date | Day of the trade. |
| Open | Opening price for today.
Note: Yesterday’s close is not necessarily today’s open since trading is done overnight on Instinet. |
| High | Highest price the stock reached for the day. |
| Low | Lowest price the stock reached for the day. |
| Close | Closing price for the day. |
| Volume | Number of shares traded for the day. |
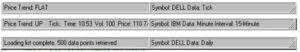
The Time & Sales status bar, at the bottom of the window, displays the following information:
- Current task the system is performing, such as Retrieving Data or Loading List Complete
- Number of data points retrieved
- Symbol, such as IBM
- Time & Sales table type, such as tick, minute, daily, weekly, monthly
- Price trend, such as Price Trend Flat, Price Trend Up, or Price Trend Down
- For minute data: Tick time, volume, and price
Status Bar Examples
When you right click on a Time & Sales table, a menu of available options appears. The following table presents the right mouse menu options you use to perform the Time & Sales functions.
| To perform this function: | Click the right mouse button and select |
| Trade online from Time & Sales | The Online Trade Service Note: Only available if you have an online trade account. |
| Search for a symbol | Company Search |
| Get data for a Time & Sales table | Get Data |
| Filter Time & Sales data | Filter |
| Re-display filtered data | Undo Filtering |
| Select Time & Sales data columns and order | Settings |
| Select Load Data Options | Settings |
| Select Time & Sales colors | Settings |
| Select Time & Sales font | Settings |
| Print Time & Sales data | |
| Save Time & Sales data to a file | Save to File |
| Get a SnapQuote for the selected symbol | Snap Quote |
| Create a DTN.IQ Chart for the selected symbol | Chart |
| Access news articles for the selected symbol | News |