Listed below are some resources for answering the most common questions about using DTN.IQ
Download & Install DTN.IQ
Minimum Computer Requirements
- Windows 7, Windows 8, Windows 10
- Intel® Core™ i3 / i5 / i7 (or equivalent) is the minimum processor architecture with the speed simply being something along the lines of “depends on usage but faster=better”. Ultimately, the faster (higher ghz) the CPU is, the better it will perform for streaming data. More cores will perform better for history downloads.
- High Speed Internet (5mbps min.)
The more symbols you watch, especially if they are very active symbols, the more RAM and Bandwidth you potentially need. If you have questions, please contact your Customer Service Team.
Auto Install Software
The DTN.IQ software installation process is automated. As soon as the download is complete, an install wizard will complete the installation process for you.
Prior to running the DTN.IQ for Windows, you must have your USER ID and PIN/PASSWORD, which we will send to you by email upon completion of our online subscriber registration process. This applies to both regular subscriptions and trials.
Manual Download and Install
When you download or save the DTN.IQ file your will be able to locate the file iqsetup2117.exe (Official Release Windows 7/10 Compatible) 3/21/2017 in the Windows default folder location of Downloads.
It is advisable to have all other application closed prior to installing DTN.IQ. Be sure to disable any Virus Scan software which may interfere with the installation.
Start receiving data through DTN.IQ
Double Click on the DTN.IQ icon located on your desktop. ![]()
DTN.IQ is approximately 2.14 mb and will take less than 30 seconds to download.
If you are experiencing problems receiving real-time market data through your DTN.IQ software, there could be several causes.
Possible Causes Of Service Interruption
Not Connected To Internet: Verify you are connected to the internet. You can test your connectivity with the website www.speedtest.net (Test Server: Omaha, Nebraska)
Exchange Interruptions: Occasionally, the exchanges will experience service interruptions which impact the sending of real-time data. When this happens, our Engineers immediately contact the exchange in order to facilitate quick restoration of service.
Internet Disruptions: Occasionally, disruptions will occur due to Internet-based outages between your Internet Service Provider (ISP) and DTN. We have redundant Internet connections, so this should be extremely rare. If you are unable to reach our primary servers, DTN will automatically try to connect to our fully redundant backup facility.
Power Cycle Connection: Rebooting your modem/router will re-establish your internet connection. This may help improve download speeds and resolve internet latency issues.
- Unplug the power from your modem/router.
- Power off your computer.
- Plug modem/router in and wait 90 seconds.
- Turn on your computer.
Troubleshooting Slow or No Data
The IQ client has the built in ability to perform a Trace Route. Performing a Trace Route may uncover internet latency issues. This information can assist you when contacting our Internet Service Provider (ISP) to resolve internet slowness or packet loss.
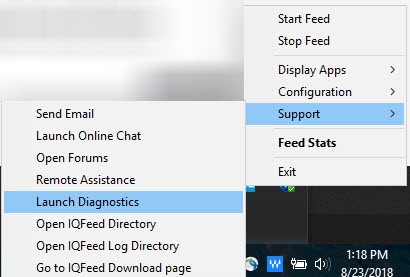
- In the lower right hand corner of your monitor where you see your clock, Locate the icon just to the left called “Show hidden icons”. Under this icon your should find the IQ Connection Manger.

- Click on IQ Connection.
- Move your mouse to Support and click on Launch Diagnostics
- Click on the Connectivity Tab at the top of the Diagnostics Utility window.
- Click on the Trace Route button to complete the process.

- Traceroute is a utility that records the route (the specific gateway computers at each hop) through the Internet between your computer and a specified destination computer. It also calculates and displays the amount of time each hop took. Traceroute is a handy tool both for understanding where problems are in the Internet network and for getting a detailed sense of the Internet itself.
If you look at each line, you will see 3 numbers followed by an ‘ms’(Milliseconds), then the IP Address of the router that the data is flowing through. The last line you should see will be the DTNiQ server.
Typically these milliseconds time should not go over 100. When they begin to rise higher than 200, you will generally experience problems with data not updating properly, or not at all. Sometimes, you may not even be able to login because the PC may not be able to acknowledge the login with the server.
If these millisecond numbers are replaced with “Request timed out” you will generally not be able to login or receive data at all.
In either case, the problem is generally with your ISP or the backbone of the internet itself. Each line shown on a trace route indicates a router on the internet directing traffic to its final destination. If a particular router is down, or being flooded with traffic, this may cause problems with receiving a good connection to our servers. Occasionally, the router will not have the proper routing table and be unable to determine where to direct the traffic. If this is the case you will generally see the IP Address on a line replaced with the words ‘Destination Host Unreachable’. Most of these problems are usually temporary conditions.
If after running the trace route you do not notice any high millisecond times, or if you see any messages pertaining to Request Time out or Host unreachable. You may also receive a message from the IQ connection window ‘Retrieving IP’. All of these messages may point to a firewall that is either installed locally on the PC or if the PC is behind a firewall on a corporate network. A firewall installed on the PC itself will need to be configured to allow the DTNiQ and iqconnect.exe applications and processes through the firewall to access our data servers. You should consult with the documentation provided with their software based firewall programs. If you are on a corporate network with a firewall, have your Network Administrator contact our technical support department (800-779-7299) so we may provide the settings they will need to open the firewall to allow the DTNiQ and IQ Feed client to access the internet and our data servers.
- Click the START button on the lower left side of your Windows desktop
- Click on SETTINGS
- Click on CONTROL PANEL
- Double Click on ADD/REMOVE PROGRAMS
- Click on DTN.IQ for Internet and/or IQFeed Client once to highlight the program(s)
- Click on the ADD/REMOVE button
- Answer “Yes” when/if prompted to remove shared files
DTN.IQ User's Manual
- Chart Window
- Chart Toolbar Buttons and Menus
- Chart Status Bar
- Drawing a Price Chart
- Searching for Symbols
- Selecting Price Chart Colors
- Drawing a Candlestick Chart
- Selecting Candlestick Chart Colors
- Deleting and Restoring Ticks
- Deleting and Restoring Minute Bars
- Redrawing a Chart
- Opening Multiple Chart Windows
- Displaying/Hiding the Volume Chart
- Selecting Average Period Data for a Volume Chart
- Selecting Volume Chart Colors
- Drawing Trendlines
- Deleting Individual Trendlines
- Deleting All Trendlines
- Selecting Trendline Colors
- Displaying/Hiding Moving Averages
- Displaying Moving Averages Exponential Data
- Setting Moving Averages Intervals
- Selecting Moving Averages Colors
- Displaying/Hiding Bollinger Bands
- Selecting Moving Averages Period for Bollinger Bands
- Selecting Number of Deviations for Bollinger Bands
- Selecting Bollinger Band Colors
- Displaying/Hiding Indicator Charts
- Displaying RSI Indicator Charts
- Displaying Momentum Indicator Charts
- Displaying ROC Indicator Charts
- Displaying OBV Indicator Charts
- Displaying MACD Indicator Charts
- Displaying Stochastics Indicator Charts
- Displaying a Volume Chart
- Displaying Money Flow Indicator Charts
- Displaying Money Flow Index Indicator Charts
- Displaying Average Directional Movement Index Indicator Charts
- Selecting Default Chart Increment
- Selecting Default Minute Interval
- Selecting Default Chart Type
- Selecting the Y Axis Orientation
- Setting Data Point Intervals
- Displaying/Hiding Grid Lines Default
- Selecting Grid Line Style
- Selecting Y Axis Scaling
- Selecting Chart Scrolling Options
- Selecting Load Minute Data Options
- Selecting Load Tick Data Options
- Selecting Background and Grid Colors
- Selecting Indicator Chart Label and Data Colors
- Displaying/Hiding Grid Lines
- Displaying Details or Full View of Chart Data
- Printing Charts
- DDE Linking Overview
- FIDs that can be Linked
- DDE Link Macro
- NASDAQ Level II Window
- Toolbar Buttons and Menus
- Level II Right Mouse Menu
- Accessing NASDAQ Level II Data
- Inputting a New Symbol
- Searching for a Company Symbol
- Entering Number of Hours Offset from New York
- Displaying Lists in Gray or Color When the Market Is Closed
- Level ll Data Description
- Ordering Level II Data Columns
- Adjusting Column Width
- Selecting Fonts
- Printing Data
- Saving Level II Data to a File
- Adding/Deleting Color Tiers
- Changing the Colors of Tiers
- Sorting Tiers
- Highlighting Market Makers to Follow
Price and Size Distribution Bars
- Showing/Hiding the Price Distribution Bar
- Showing/Hiding the Size Distribution Bar
- Showing/Hiding Time & Sales Data for Selected Symbol
- Selecting Colors for Time & Sales Data
- Adjusting Column Width for Time & Sales Data Table
Level l Quote and Fundamental Data
- Displaying/Hiding Level I Data
- Ordering Level I Data Columns
- Selecting Colors for Level I Data
- Trading Online from DTN_IQ NASDAQ Level II
- Opening Related DTN_IQ Applications from NASDAQ Level II
- Login Overview
- Logging into DTN.IQ
- Closing DTN.IQ
- News Tabs
- News Toolbar Buttons
- News Right Mouse Menus
- Searching for Headlines
- Displaying a Full Article
- Selecting the Number of Headlines to Retrieve
- Adding Filters/Alerts for Individual Symbols
- Removing Filters/Alerts
- Editing Filters/Alerts
- Searching News Services by Symbol
Print, Save, and Copy Articles
- Printing Articles
- Saving Articles
- Bookmarking Articles
- Email Articles
- Option Chains Window
- Option Chains Data Description
- Toolbar Buttons and Menus
- Status Bar
- Option Chains Right Mouse Menu
- Level I Right Mouse Menu
- Equities Criteria
- Futures Criteria
- Futures Options Criteria
- Futures Spreads Criteria
- Accessing Option Chains Data
- Inputting a New Symbol
- Searching for a Company Symbol
- Sorting Data
- Filtering Data
- Sample Filter Conditions
- Hiding Selected Rows
- Redisplaying Filtered Data and Hidden Rows
- Customizing Greeks
- Calculating Greeks
- Greeks Calculator Input Data
- Sample Greeks Calculator
- Recalculating Greeks
- Displaying or Hiding Calls or Puts Data
- Displaying or Hiding Calls and Puts Column Headings
- Displaying or Hiding Zero Volume Calls and/or Zero Volume Puts
- Hiding Option Chains Data Columns
- Displaying Option Chains Data Columns
- Ordering Option Chains Data Columns
- Freezing Columns
- Adjusting Column Width
- Selecting Fonts
- Selecting Colors
- Printing Data
- Saving Option Chains Data to a File
Level l Quote and Fundamental Data
- Displaying/Hiding Level I Data
- Displaying/Hiding Specific Level I Data Columns
- Ordering Level I Data Columns
- Selecting Colors for Level I Data
- Opening Related DTN_IQ Applications from Option Chains
- SmartMarket Window
- SmartMarket Data Description
- SmartMarket Right Mouse Menu
- Accessing SmartMarket Data
- Available Conditions
- Custom Scan Window
- Custom Scan Data Description
- Accessing Custom Scan Data
- Printing Data
- Saving Data
- Snap Quote Window
- Toolbar Buttons and Menu
- Right Mouse Menus
- Snap Quote Data
- Viewing Snap Quotes from DTN_IQ
- Opening Multiple Snap Quote Windows
- Viewing Snap Quotes from a Watch List
- Searching for Symbols
Customize the Snap Quote Window
- Selecting Snap Quote Window Colors
- Printing Snap Quote Data
- Trading Online from DTN_IQ Snap Quote
- Opening Related DTN_IQ Applications
- Time & Sales Window
- Time & Sales Toolbar Buttons and Menus
- Time & Sales Data
- Time & Sales Status Bar
- Status Bar Examples
- Time & Sales Right Mouse Menus
- Creating Time & Sales Tables
- Recreating Time & Sales Tables
- Filtering Time & Sales Data
- Set Filter Example
- Redisplaying Filtered Data
- Opening Multiple Time & Sales Windows
- Searching for Symbols
Customize the Time & Sales Window
- Displaying the Order of the Data
- Adjusting Column Width
- Selecting Load Data Options
- Setting Time & Sales Defaults
- Selecting Time & Sales Font
- Selecting Time & Sales Colors
Print and Save Time & Sales Data
- Printing Time & Sales Data
- Saving Time & Sales Data
- Trading Online from DTN_IQ Time & Sales
- Opening Related DTN_IQ Applications
- Watch List Window
- Right Mouse Menus
- Watch List Data
- Opening a Watch List
- Opening Multiple Watch Lists
- Using the Add Watch List Wizard
- Searching for a Symbol from the Add Watch List Wizard
- Removing a Watch List
- Adding Symbols
- Annotating Watch Lists
- Searching for a Symbol
- Viewing a List of Available Exchanges
- Copying a Quote
- Removing Symbols or Annotations
- Changing the Order of Symbols or Annotations
- Adding a New Alert
- Editing an Alert
- Enabling or Disabling Alerts
- Deleting an Alert
Customize the Watch List Window
- Displaying and Ordering Data
- Removing Columns from a Watch List
- Adjusting Columns
- Selecting Watch List Fonts
- Selecting Watch List Colors
- Freezing Columns
- Printing Watch List Data
- Saving Watch List Data to a File
- Trading Online from DTN_IQ Watch List
- Opening Related DTN_IQ Applications
- Right Mouse Menus
- Selecting the SmartBar Location
- Showing/Hiding an Attached DTN.IQ Toolbar
- Showing/Hiding the Company Logo
- Selecting SmartBar Title Bar Colors
- Selecting Color Printing for DTN.IQ Applications
- Checking for DTN.IQ Application Updates
- Selecting Trading Providers for DTN.IQ Applications
- Creating a Workspace
- Editing a Workspace
- Deleting a Workspace
- Searching for a Symbol
- Opening Workspaces
- Opening Workspaces Automatically
- Minimizing Workspace Applications
- Restoring Minimized Workspace Applications
- Closing Workspace Applications
Connect and Disconnect Overview
- Connecting to DTN.IQ
- Disconnecting from DTN.IQ
DTN.IQ FAQ's
You can set multiple keyword filters for DTN.IQ’s News window, enabling you to scan for news stories containing those keywords.
To set keyword filters, as well as symbol filters, click the funnel symbol on DTN.IQ’s News window. This will launch the filters window.
Once your filter is set, you can add keywords such as company names, products or other specific terms or phrases. Your filter will display under the Filters tree item.
One thing to bear in mind when picking keywords, the more generic the term, the greater the chance of the filter trapping stories which may or may not be of interest to you. For example, the term “battery” may return stories about battery manufacturers or crimes involving the crime of battery.
DTN.IQ’s watchlist feature comes with a default column setting starting with news, tick, symbol, change, last, etc. You can alter the arrangement of these columns, as well as add and subtract columns.
To modify watchlist columns, click on a column header, then hit the Insert key on your keyboard. You will then see a list of available columns you can add to your list. If you want to replace the currently selected column, click the checkbox for that option.
To move columns, highlight a column by clicking on the header. Then use the right or left arrow keys on your keyboard to move the column the appropriate direction. You can also “drag and drop” the column to the location you desire.
Basic DTN.IQ includes a ’24/7′ news feed from PRNewswire, Business Wire, and DTN’s own Newsroom. Additional premium services include AP Online News, Reuters AG, MidnightTrader, RealTimeTraders, theflyonthewall.com and Dow Jones newswires. Literally hundreds of stories flow through DTN.IQ’s News window every day . You can also access news relevant to any symbol you track through a Watchlist, Chart, Snap Quote, or Time & Sales window. Look for the ‘N’ symbol on the menu bar of all these applications. To view news for a watchlist symbol, first look for a number in the News column of the watchlist. The number indicates there is news for today on this symbol. You can view both current and archived news on any watchlist symbol by double clicking on the news column. This will display a window with all stories from all the news services to which you currently subscribe.
You can export a watchlist to most spreadsheet software programs like Microsoft Excel using the ‘Save Data File’ function in DTN.IQ.
To export a watchlist, right click on the watchlist and select the ‘Export to File’ menu item. This displays a window that lets you choose either a comma or tab delimited format. Once you have chosen a format, save the resulting file to your hard drive, taking care to remember where you saved it.
You should now be able to open the resulting file in most spreadsheet programs. You may have to choose the ‘All Files’ option in order to select the correct file to open.
You can also choose the Save As DDE Formulas option which will allow your spreadsheet to receive dynamic updates from DTN.IQ when running in Excel.
You can easily export Time and Sales, as well as historical data on any stock to your favorite spreadsheet application for further analysis.
First select the display period you wish to view for a particular equity, whether tick-by-tick, every minute, or a daily or weekly snapshot.
To export Time and Sales on a selected equity, click on the ‘Computer Disk’ image on the Time and Sales window. This will display the CSV Options window. Choose the format in which you wish to save your data, whether comma or tab delimited. Make sure to remember the location on your hard drive where you save the .csv file.
You should now be able to open the .csv file in your favorite spreadsheet application. You may need to select ‘All Files’ in order to see the .csv file through your application.
The news field contains a count of the number of stories received TODAY for any symbol in your watchlist. When you open a watchlist, our server returns the total number of stories for today and displays this number in the News Field. If you receive a new story for a symbol while the watchlist is open, the number will increase and change color to signify that a new story has been received. When you double click the news count, the News application will open to display the headlines for that symbol. Once you do this, the color of the news count will change, to show that you have viewed all available headlines since the last headline came in.
There are various tree items in the news window. If you click on ‘All News’ headlines display from all newswires you are currently authorized for. By clicking the plus sign next to a tree item, you will view an expanded list of sources. This lets you view only headlines from a specific source. You can add new newswires to your service by contacting Customer Support or view our Premium Services listing on our website.
You can also set up filters and alerts based on criteria you choose. If you have a text-to-speech engine on your computer (or you can download one from us), your computer can even read the alerts to you.
If you are authorized for real-time options, open the Option Chain window by clicking on the icon with the chain links. In the upper left corner of the Option Chain window, type in a stock symbol in the text field.
Click the green arrow with the ‘N’ to view near-term options.
Click the green arrow with the ‘A’ to view all options and leaps.
Calls and puts will update in the lower portion of the window.
If you have delayed options quotes, you can still view options in all other DTN.IQ applications. Just enter the symbol into a watchlist or snap quote to view the latest data. You can also right click on an equity symbol in the watchlist and select “Insert Equity Options” from the menu to have the option contracts automatically added to your watchlist.
DTN.IQ uses the format ‘XXX XX’ for equity options. To add options to your watchlist, right click in your watchlist, select ‘Insert Equity Options’ from the menu. Type in a root equity symbol, and the contracts you wish to retrieve. click OK and the option contracts will automatically be added to your watchlist.
Open the Time and Sales window by clicking on the icon containing the clock. DTN.IQ’s default information displays time, price and volume columns.
To add the bid and/or ask columns, right click in the Time and Sales window. In the menu, select ‘Settings.’ Click on the tab labeled ‘Tick Column Order.’ Highlight ‘Bid,’ then click ‘Add.’ Bid moves to Displayed Columns on the right side of the window. From this window you can add, remove, and arrange columns displayed in the Time & Sales window.
Click the tabs to see more custom settings to personalize DTN.IQ.
When you bring up a DTN.IQ Time and Sales symbol, there are arrows pointing to either the bid or the ask price. The arrows indicate which price the stock traded at, either the bid or the ask price. Sometime an order is filled outside the best bid or ask, so there will not be an arrow displayed.
Open the Smart Market window by clicking the SM icon located in the DTN.IQ toolbar. (Smart Market is a premium service available for $8/month).
At the top of the Smart Market window, click on the tab relating to the exchange you would like to view. Market scans are available on the NYSE, AMEX, and Nasdaq exchanges.
Click on an icon in the left hand menu. There are many choices available, containing:
- Most Actives
- Percent Increase
- Percent Decrease
- Most Volatile
- Price Increase
- Price Decreases
Smart Market will retrieve up to the top 50 stocks, and update the list constantly. Be sure to try out all the parameters.
If you need more than these scans, try our Custom Scans product for $25/month.
Using any of the quote windows, you are able to view not only stock data, but futures, options, indices, mutual funds, and more. All at no extra cost! For symbology, please visit our improved Symbol Search!
To do this, click the row number for the row you want to highlight. Then click on ‘Settings’ and change the font settings to your desired highlight colors. Only the row highlighted will take on the colors you choose. You may do this at a row, column, or individual and group of cell level.
This is a quick and easy way to retrieve a Snap Quote. Also, to get Fundamental Data on the Snap Quote, click on the Yellow FD button that is located to the right of where the symbol is. This allows you to toggle between standard and fundamental data formats.
First, select the entire watchlist by clicking the cell at the very top left side of your spreadsheet (between the headers and row numbers). Once all cells are highlighted, click the settings button at the top of the watchlist. In the colors area, set the default background to black and the foreground to white. Change the upward trend background to green, and the foreground to white. Change the downward trend background to red, and the foreground to white. Change the annotation background to blue, and the foreground to white. Choose a good font, such as Times New Roman with a 10 point font size. Set your precision (2 or 4 is a good choice). Click OK, then click inside your watchlist to see all the color!
If your computer and bandwidth is fast enough, you can watch as many as 1300 symbols at one time using DTN.IQ. This is especially important if you use Option Chains and want to see all option contracts for a symbol, including LEAPS!
Did you know that we offer a live chat room that is available from 6:30 AM Central time to 6:00 PM Central time Monday through Friday? Just go to our DTN Website and click on the Live Chat button located on the right side of the screen. You can choose to chat with either a sales representative or a tech support representative. This is a quick and easy way to get an answer to a question. You can also access the chat support by right clicking your IQ toolbar and choosing “DTN.IQ Live Customer Support Chat”.
From within the Snap Quote window, click on the C icon to get the chart for that symbol.
If you have a list of symbols in a spreadsheet or other application that displays the symbols in a column, just highlight the symbols and choose COPY from the EDIT menu of that application (or click CTL-C on your keyboard). This will copy the symbol list to your computer clipboard (a hidden area of your computer). Then, open a DTN.IQ watchlist, click in a symbol cell, and choose PASTE from the EDIT menu (or click CTL-V on your keyboard). The symbols will fill into your watchlist and start updating with data.
To switch from option chains to futures, futures options and futures spreads, open the Option Chains window in DTN.IQ. On the task bar at the top of the window, select the ‘open ledger’ icon to the right of the binocular icon. This will open the Options, Futures, Spreads Display Criteria settings window. You can use this window to configure your display, including the months and years you wish to view.
To move a row, click on the row number to highlight the entire row. Then use the UP or DOWN arrow key on your keyboard to move it the direction desired. You may also click on the row number and DRAG and DROP the row to the desired location.
To move a column, click on the column header to highlight the entire column. Then use the LEFT or RIGHT arrow key on your keyboard to move it the direction desired. You may also click on the column header and DRAG and DROP the column to the desired location.
The Latest Headline field contains the last headline received since you opened your watchlist. When a story is received for any symbols you are watching, the headline for that story will appear in this Field. You can view the full text of the story by double clicking the Latest Headline Field.
You can create a chart for the symbol you are looking at in Snap Quote simply by clicking the ‘C’ on the Snap Quote toolbar.
You can toggle to show or hide Fundamental Data in a Snap Quote Window. To do this you simply click on the FD button on the Snap Quote toolbar.
You can access Help in the software by clicking the purple book on the IQ smartbar. You can also access segment-specific Help within each segment of the software by pressing the F1 key or by clicking Help on the menu.
When DTN.IQ loads, it automatically opens a “Message of the Day” screen. From this screen you can click on the colored lights at the top of the window to check the System Status for Quote Status, Internet Status, News Feed Status, Application Status and Support Status. If there are problems or changes within these areas you can see them right in your software! This window also displays Customer Support contact information, product version information and weather information. You can also display this information via right click on the IQ Smartbar and choosing System Message of the D
Although it is hidden from view, there is a bar between individual chart studies in the charting application. If you have more than a single chart component in the chart app (price chart, volume, lower studies, etc), move your mouse cursor in between the charts slowly until your cursor changes to a small bar with an up and down arrow on it. While this cursor is visible, click and hold your mouse, and move the cursor up or down to resize that chart component. You can also right click on a chart component and choose to expand or minimize individual charts.